This blog post shows how to investigate a potential memory leak within a Silverlight application.
The Problem
Our simple Silverlight application contains a “Memory Leak” button that removes a “Test View” from a container and replaces it with a new instance of the “Test View”.
Each time the button is pressed the display counter is incremented (see 8 in the screenshot).
Each “Test View” contains 1 million DummyData objects and we have noticed that each time the button is clicked the memory usage goes up and is never reclaimed.
You can run the example page yourself: http://stevenhollidge.com/blog-source-code/debuggingsl/
The Code
TestView.cs
using System;
using System.Collections.Generic;

namespace DebuggingSilverlightApp
{
    public partial class TestView
    {
        private const int ListCount = 1000000;
        private readonly List<DummyData> largeUseOfMemory = new List<DummyData>(ListCount);

        public TestView()
        {
            InitializeComponent();
            var guid = Guid.NewGuid();
            var number = new Random().Next(int.MaxValue);

            for (int i = 0; i < ListCount; i++)
            {
                largeUseOfMemory.Add(new DummyData()
                    {
                        Id = guid,
                        Number = number,
                        Text = "Some irrelevant dummy data consuming memory",
                        Price = 12345.6789m,
                        Date = DateTime.Now
                    });
            }
        }

        public void EventHandler(object sender, EventArgs e)
        {
            // does nothing
        }
    }

    public class DummyData
    {
        public Guid Id { get; set; }
        public int Number { get; set; }
        public string Text { get; set; }
        public decimal Price { get; set; }
        public DateTime Date { get; set; }
    }
}
MainPage.xaml.cs
using System;
using System.Globalization;
using System.Threading;
using System.Windows;

namespace DebuggingSilverlightApp
{
    public partial class MainPage
    {
        public event EventHandler DummyEvent = delegate { };

        public int Counter { get; set; }

        public MainPage()
        {
            InitializeComponent();

            UpdateDisplayCounter();
        }

        private void btnHangTime_Click(object sender, RoutedEventArgs e)
        {
            try
            {
                throw new Exception("Dummy exception");
            }
            catch
            {
                // oh dear, we're swallowing the exception - bad programming!
            }
            Thread.Sleep(30000);
            btnHangTime.Content = "Pushed";
        }


        private void btnMemoryLeak_Click(object sender, RoutedEventArgs e)
        {
            // remove the view
            ViewContainer.Children.Clear();

            // create a new instance of the view
            var newView = new TestView();

            // the following line is the source of the memory leak, when the
            // view is cleared the previous view cannot be garbage collected
            DummyEvent += newView.EventHandler;

            // add the view to the stackpanel
            ViewContainer.Children.Add(newView);

            // increment our display counter
            this.Counter++;
            UpdateDisplayCounter();
        }

        private void UpdateDisplayCounter()
        {
            this.CounterTextBlock.Text = Counter.ToString(CultureInfo.InvariantCulture);
        }
    }
}
Create Dump File
Open Task Manager and select the Internet Explorer process (iexplore.exe), right click and Create Dump File.
Don’t forget to make a copy the location and file name of the dump file.
Install Debugging Tools
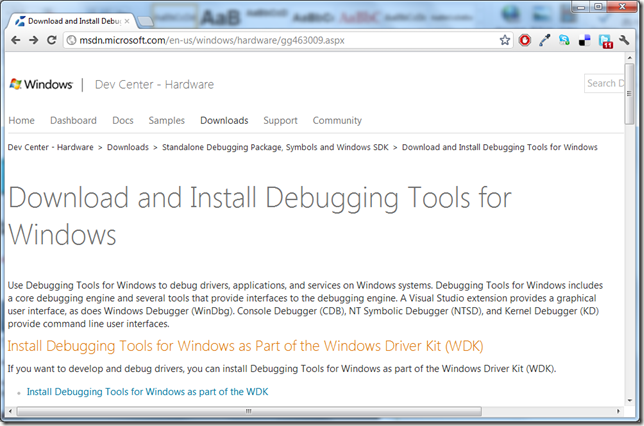
First of all we want Windbg, available as part of the Windows Driver Kit (WDK).
http://msdn.microsoft.com/en-us/windows/hardware/gg463009.aspx
The first option contains a Windows 8 Preview download that also contains the correct files for Windows 7, Server 2008 and Vista. Once this has been selected click the button to download the 1 Gb file.
This installs to: C:\Program Files (x86)\Windows Kits\8.0\Debuggers\
NOTE: If you used IE (32 bit) to create the dump file then open the x86 version of windbg.exe. I use IE (64 bit) so in this example I am using the version found in the x64 folder.
Next up download the relevant Windows Symbols files:
http://msdn.microsoft.com/en-us/windows/hardware/gg463028.aspx
When you open Windbg you’ll need to set the “Symbol File Path…”
Once this has been set, you can “Open Crash Dump…”
On my machine the Symbol files were installed to C:\Symbols
Windbg commands
Next up we want to run three commands. Depending on the combination of Silverlight version and architecture (x86 or x64) you’ll want to run the following two commands to setup your Silverlight debug session environment:
Silverlight 4 (x86)
.load C:\Program Files (x86)\Microsoft Silverlight\4.0.60531.0\mscordaccore.dll
.load C:\Program Files (x86)\Microsoft Silverlight\4.0.60531.0\sos.dll
Silverlight 4 (x64)
.load C:\Program Files\Microsoft Silverlight\4.0.60531.0\mscordaccore.dll
.load C:\Program Files\Microsoft Silverlight\4.0.60531.0\sos.dll
Silverlight 5 (x86)
.load C:\Program Files (x86)\Microsoft Silverlight\5.1.10411.0\mscordaccore.dll
.load C:\Program Files (x86)\Microsoft Silverlight\5.1.10411.0\sos.dll
Silverlight 5 (x64)
.load C:\Program Files\Microsoft Silverlight\5.1.10411.0\mscordaccore.dll
.load C:\Program Files\Microsoft Silverlight\5.1.10411.0\sos.dll
Ok, now you are ready to investigate the heap to see what objects are on it:
.dumpheap -stat
Here you can see 8 million instances of DummyData taking up 5.76 Gb of space, with 6.8 million "free" objects taking a further 2.58 Gb. This would point to each view remaining in memory and not being reclaimed by the GC.
Production
You may want to make use of the excellent DebugDiag tool to create your dumps in production based on a certain criteria or rules.
Debug Diag: http://www.microsoft.com/en-us/download/details.aspx?id=26798
Other Extensions
AdPlus: Installed as part of the WDK, same directory as Windbg.
PssCor2: http://www.microsoft.com/en-us/download/details.aspx?id=1073
SOSEx: http://www.stevestechspot.com/SOSEXV40NowAvailable.aspx


No comments:
Post a Comment