Note: This has been tested on x86 machine, I’ll update at a later point for x64 machine.
SOS (Son of Strike) Debugging Extension
You’ll need to set the “Enable unmanaged code debugging” property on the project to true.
From the Immediate window you can execute the following commands:
| Task | Command |
| Load the extension | .load sos |
| Displays all .NET objects in memory [memory table, item count and total size] | !DumpHeap –stat |
| Displays all instances of that particular type [memory address, memory table, size] | !DumpHeap –mt <method table id> |
| Displays all objects holding a reference to an object address | !gcroot <address> |
| Outputs the current Call Stack | !CLRStack |
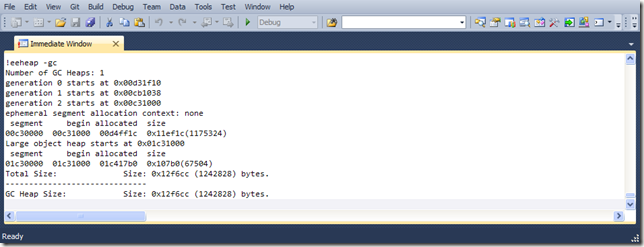
| Outputs info on objects on the heap | !EEHeap -gc |
| Lists all threads | !threads |
| Lists work threads info | !threadpool |
SOSEx is an extension that gives you more commands to help debugging (scroll to the end of the blog post for the link).
Dumps
Once you create a dump from your process (.dmp file), you can load it back into Visual Studio and the IDE will load the source file and you’ll be able to look at the variables at that point in time.
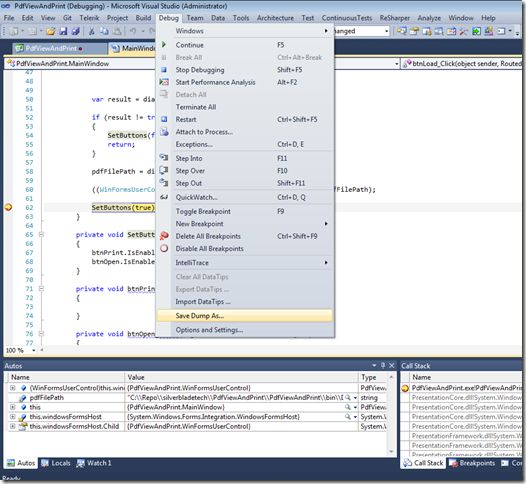
You can generate a dump file from Visual Studio by hitting a breakpoint and selecting Debug > Save Dump As. You can close your solution and open the dump file in Visual Studio.
To generate a dump file in production take a look at SuperAssert.NET.
Link Resources
SOSEx: http://www.stevestechspot.com
SuperAssert.NET can help generate dump files in production: http://msdn.microsoft.com/en-us/magazine/cc188701.aspx
Install Windows SDK: http://msdn.microsoft.com/en-us/windows/hardware/gg463009.aspx


No comments:
Post a Comment