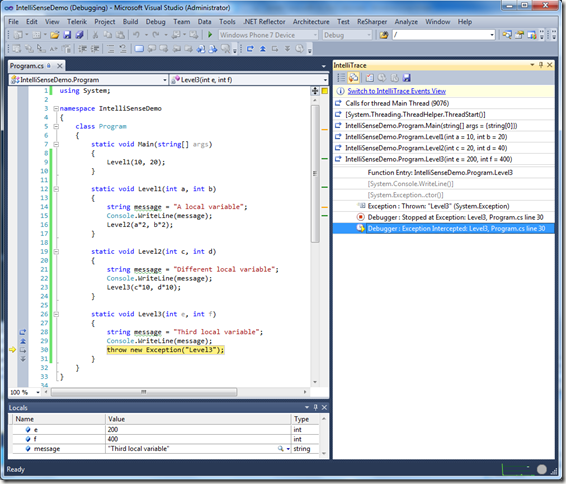
IntelliTrace collects information whilst your application is running so you, as a developer, can rerun through the code flow to identify and debug exceptions.
Here’s how to switch IntelliTrace on:
Tools > Options > IntelliTrace, then select Enable IntelliTrace:
You can see now when we run through our sample app, the IntelliTrace has tracked all the input parameters for each of the methods so we can step back in time to a previous method.
There are two views in IntelliTrace, the first being “Calls View” which we can see here listed on the right hand side (notice all the input variables are traced).
Below we have stepped back in time to Level2, notice local variables weren’t stored here but you can still step through the code flow.
We are going to add additional events to the default traced events, by returning to Tools > Options > IntelliTrace section and selecting IntelliTrace Events adding Console.
Now with Console added, in the “Events View” the Console Events are being tracked.
This is a useful technology that can be switched on in production to store traces that can be replayed back on a development machine, but under the environment of production.
In this example I’ve stored the trace file in the default location, this time set under Tools > Options > IntelliTrace > Advanced section.
Generates a file each time the application is run.
Now you can close Visual Studio 2010 completely and replay the code any time in the future on whatever machine you like. Open the iTrace file in Visual Studio 2010 Ultimate and you can see the environment settings, DLLs loaded including version ids, all the call and event tracing info.
The threading view is particularly good for seeing multi threaded apps and also garbage collection threads kicking in.
IntelliTrace is currently only available on Visual Studio 2010 Ultimate but I think it will be included in lower level SKUs in future versions of Visual Studi0. Fingers crossed for VS 2012.


No comments:
Post a Comment