Here’s some of the tools I use to debug my Silverlight Out of Browser applications and track memory consumption for Silverlight applications.
When the app starts up the user is shown the login screen. In the background, whilst the user logs in, various xap files are being downloaded asynchronously.
Here’s how the tools look on start up of the application, note no Xap optimisation tools or minifiers have been used.
HTTP Traffic
Fiddler (free)
This tool is pretty common among all web devs and tracks HTTP traffic. From this screenshot (tracking the startup of the application) we can see various external xap file requests are made to the localhost.
XAML and Resources
Silverlight Spy (commercial)
Memory Analysis
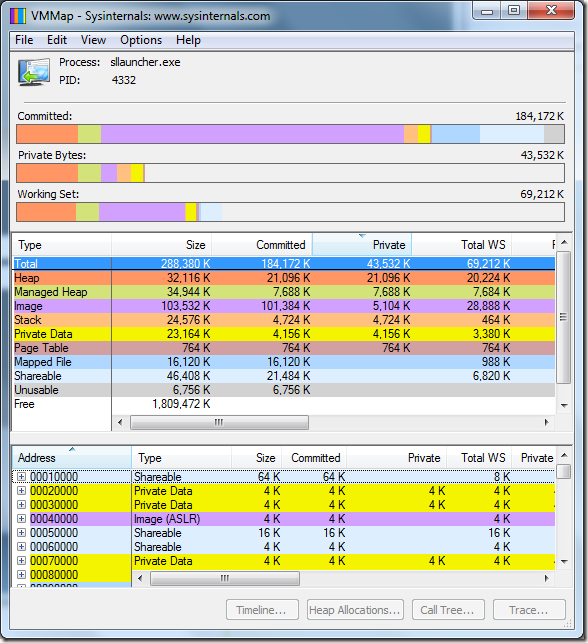
VMMap (free as part of SysInternals Tools Suite)
Select the process, in this case sllauncher.exe as it’s an out of browser application.
Here we can see the memory used by the application:
Heap – Native heap usage
Managed Heap – Silverlight and CLR heap memory usage
Image – Modules loaded
Stack – Silverlight and CLR stack memory usage
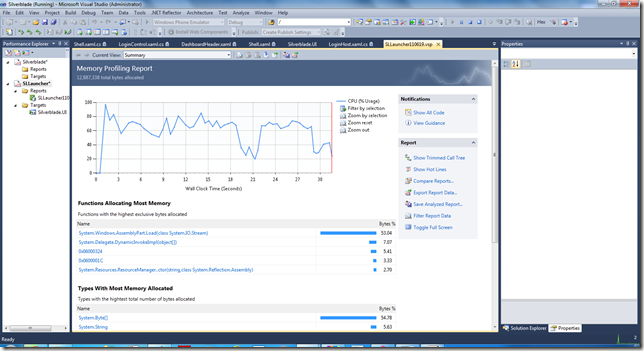
Visual Studio 2010 Profiling (Ultimate SKU)
Memory Profiling
CPU Profiling
WinDbg + SoS (Son of strike)
To be updated.
dotNet memory profiler (commercial)
To be updated.
CLR Profiler for Silverlight 4 and .NET 4 (free)
To be updated.
XPerf / HeapMonitor cmd –p %pid%
For native / unmanaged memory, to be updated.
Mike Cook is one of the leading authorities on Silverlight performance and someone to closely follow.
You can find his list of Silverlight best practises here:


No comments:
Post a Comment